E-Commerce Customer & Revenue Analysis
An end-to-end analysis of 541,909 retail transaction lines focused on revenue growth, repeat purchasing, customer retention, RFM segmentation, market performance, and commercially actionable recommendations.
- SQL
- Python
- pandas
- SQLite
- Matplotlib
- Seaborn
- RFM
- Cohort Analysis
- Business Recommendations
Business question
How can an online retailer grow revenue by improving repeat purchasing and focusing effort on the customers, markets, and products with the strongest commercial value?
I treated the project like a business analytics engagement: define valid sales, clean and model transaction data, answer commercial questions with SQL, use Python for deeper customer analysis, and translate the results into measurable recommendations.
Data & analytical approach
1. Clean & model
Corrected data types, handled missing customer identifiers, removed invalid sales and cancellations from the valid-sales definition, engineered revenue fields, and built a reusable SQLite model.
2. Query
Used SQL joins, CTEs, conditional aggregation, date functions, subqueries, ranking functions, NTILE, LAG, and cumulative calculations to answer revenue and customer questions.
3. Segment
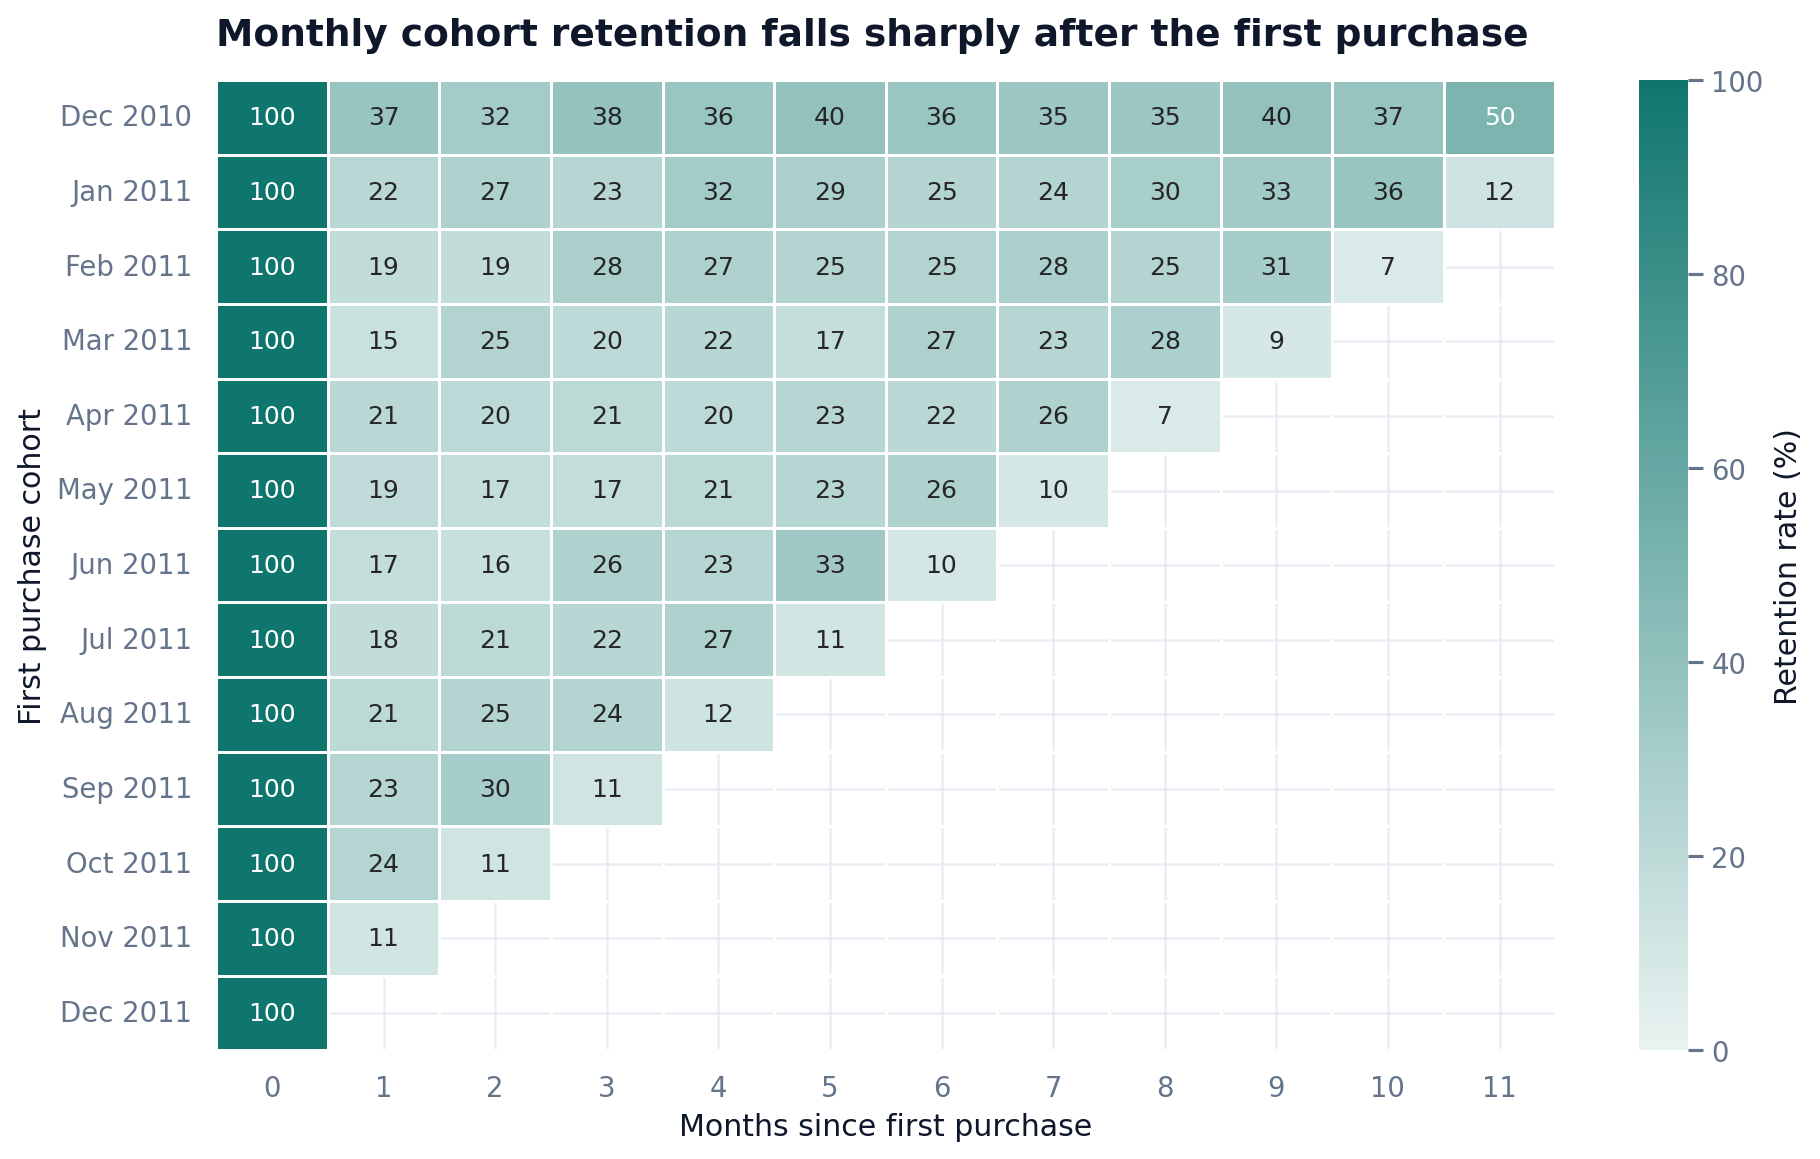
Analyzed purchase frequency, second-order timing, cohort retention, country performance, revenue concentration, product outliers, and customer value through RFM segmentation.
4. Recommend
Converted findings into lifecycle, retention, high-value customer, seasonal planning, and transaction-control recommendations with clear measurement ideas.
Selected project visuals
These are direct outputs from the project repository. Together they show the progression from executive-level performance monitoring to customer retention and segmentation analysis.
Key findings
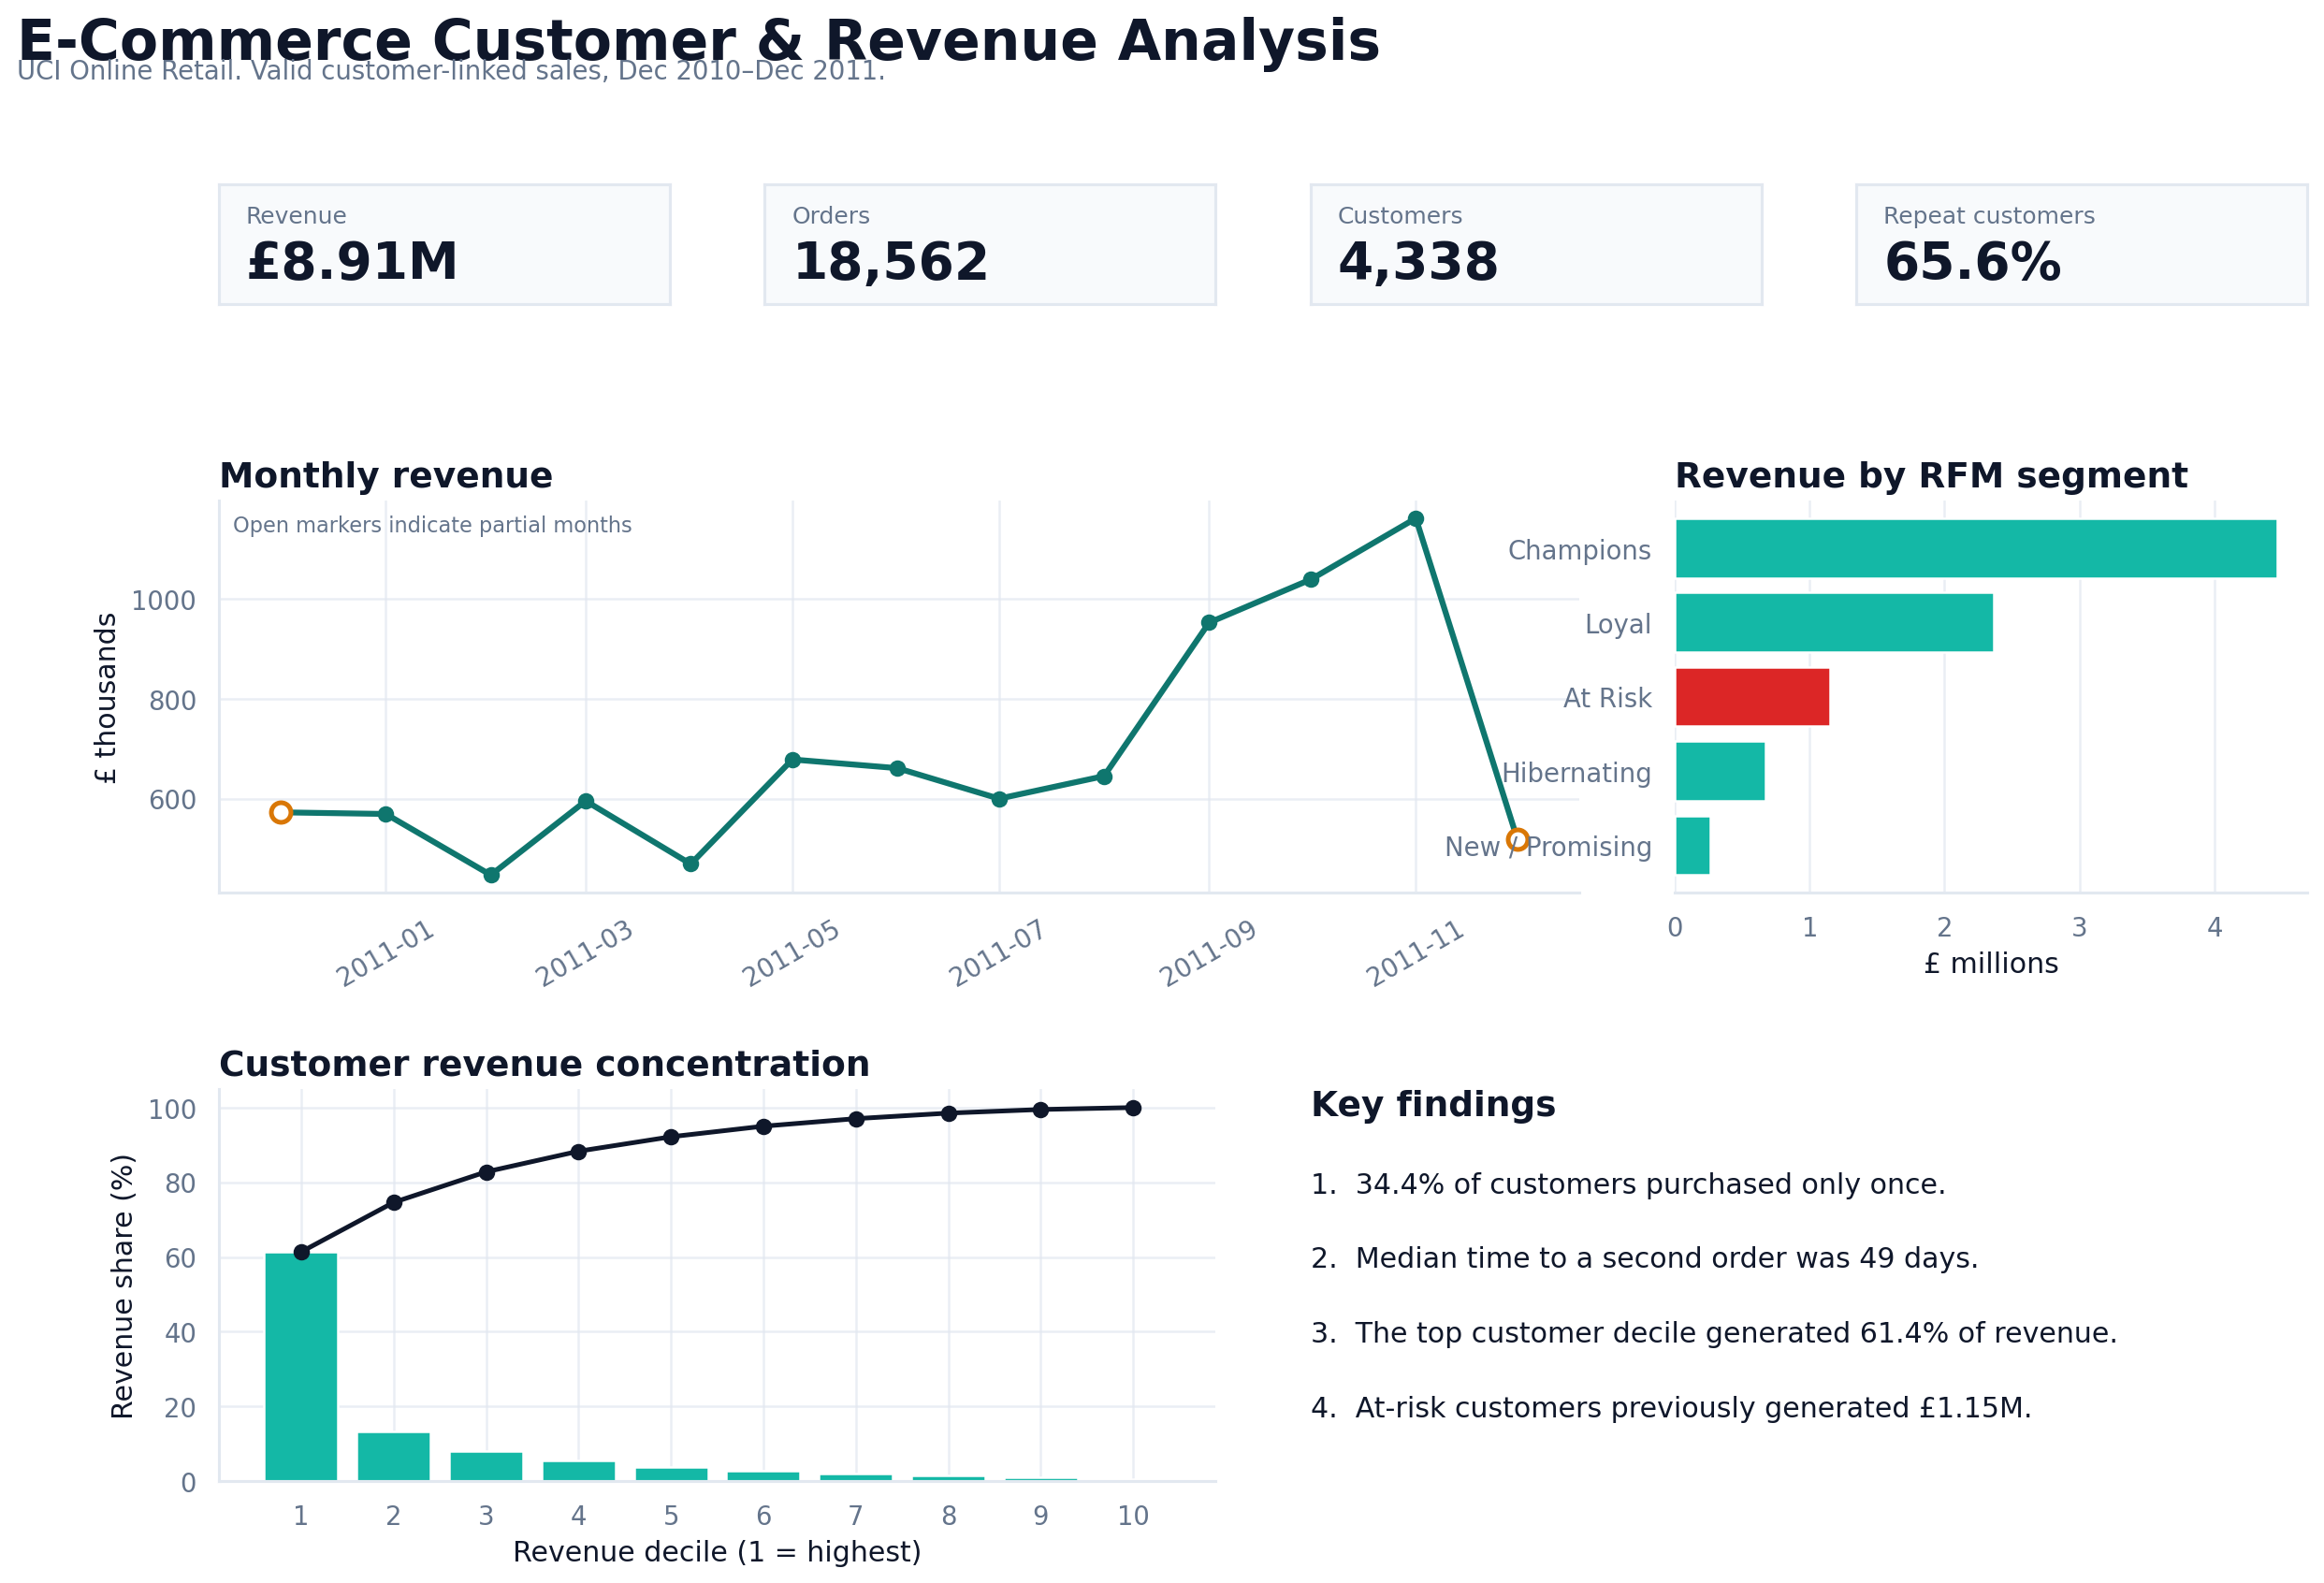
Repeat customers drive substantially more value. Customers with 10 or more orders generated £4.57M, compared with £0.62M from one-order customers.
The second-purchase window is actionable. Repeat purchasers took a median of 49 days to place their second order, giving a lifecycle team a practical timing target for follow-up messaging.
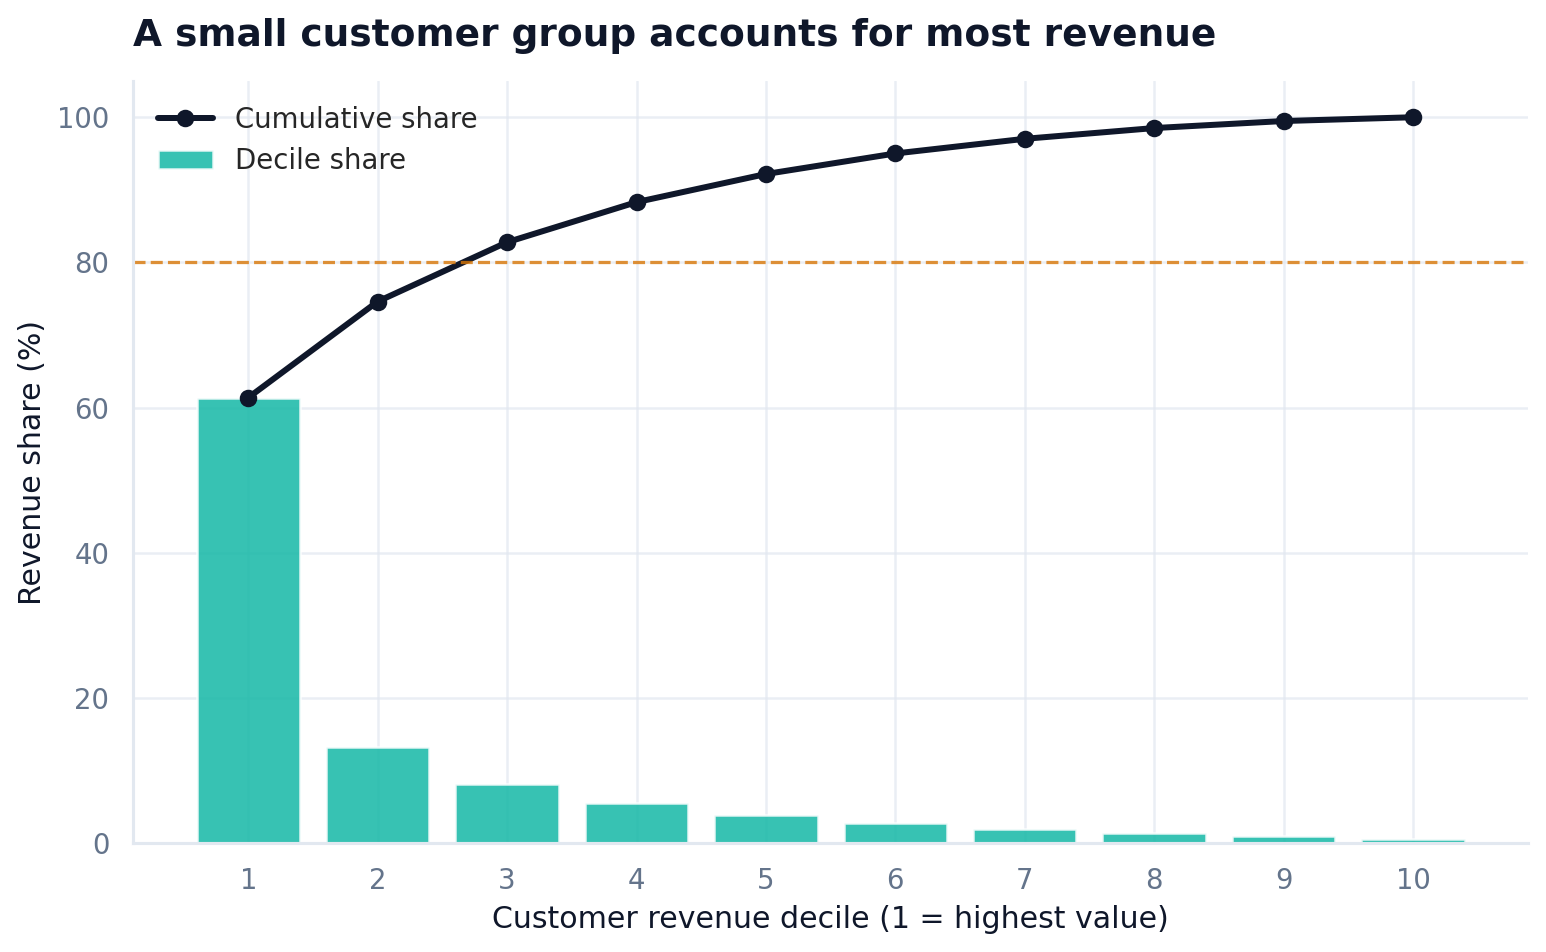
Customer value is highly concentrated. The top 10% of customers produced 61.4% of revenue, while the top 30% produced 82.8%.
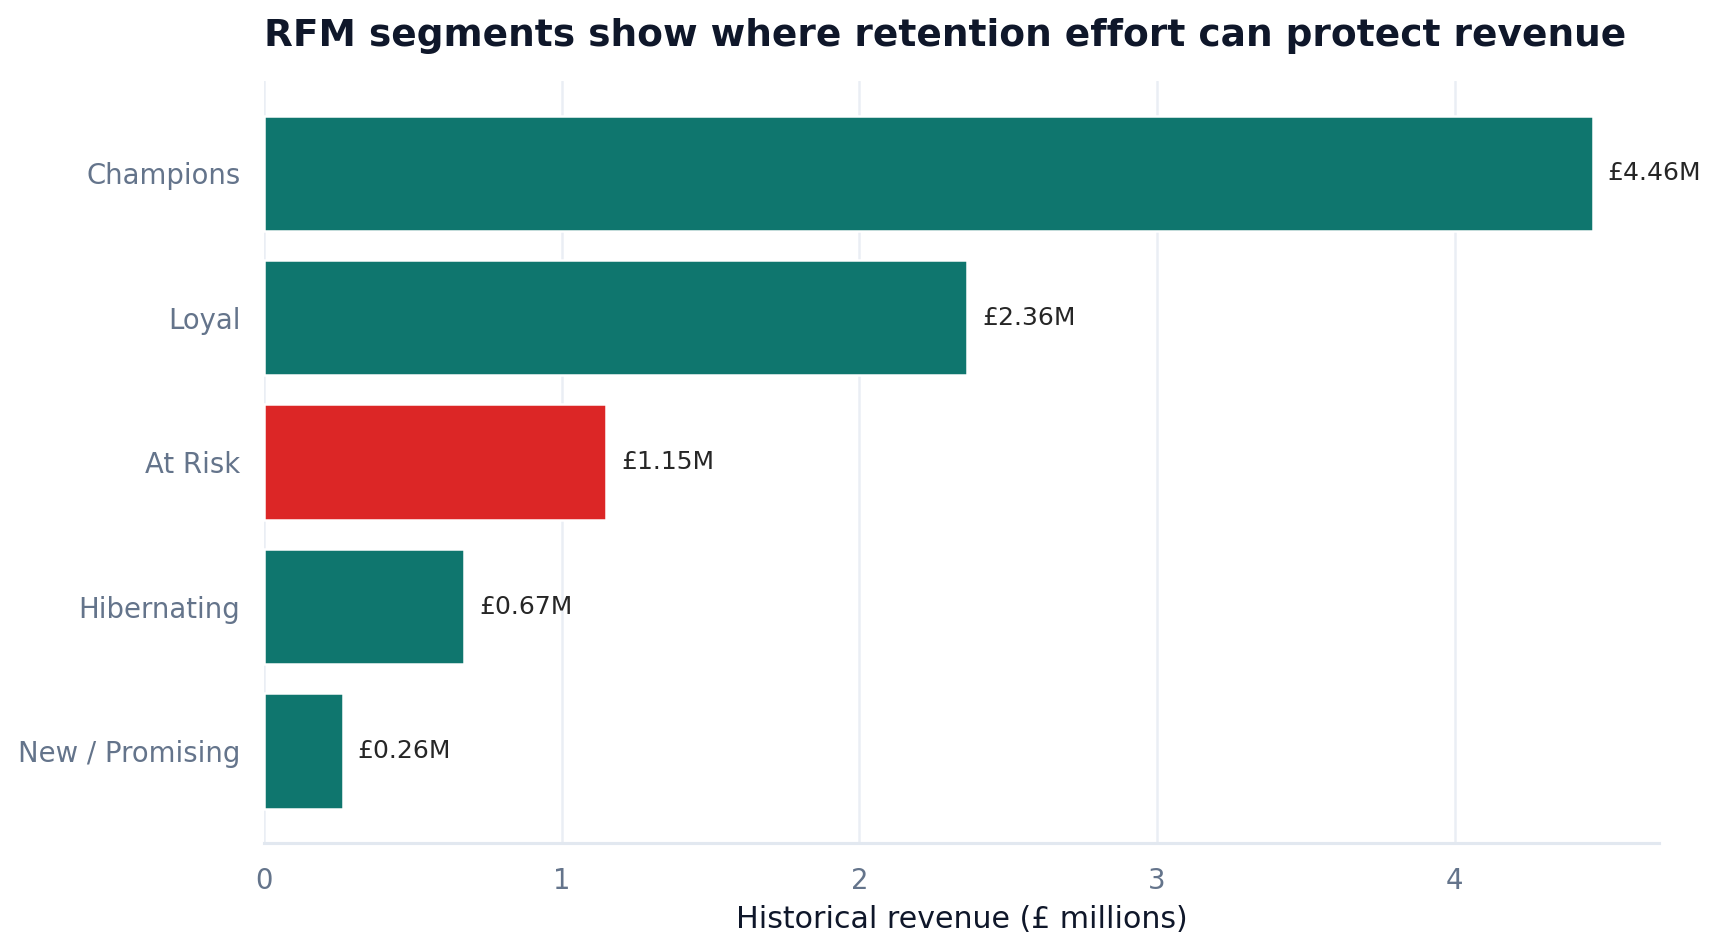
At-risk customers represent meaningful recoverable value. The RFM analysis identified 655 at-risk customers who had historically generated £1.15M.
Business recommendations
Lifecycle campaign
Test personalized reminders or complementary-product offers around days 30–45 after a first purchase, using a holdout group to measure incremental second-order conversion and revenue.
Win back at-risk value
Prioritize the 655 at-risk customers by historical revenue and use differentiated offers rather than applying the same incentive to every customer.
Protect peak demand
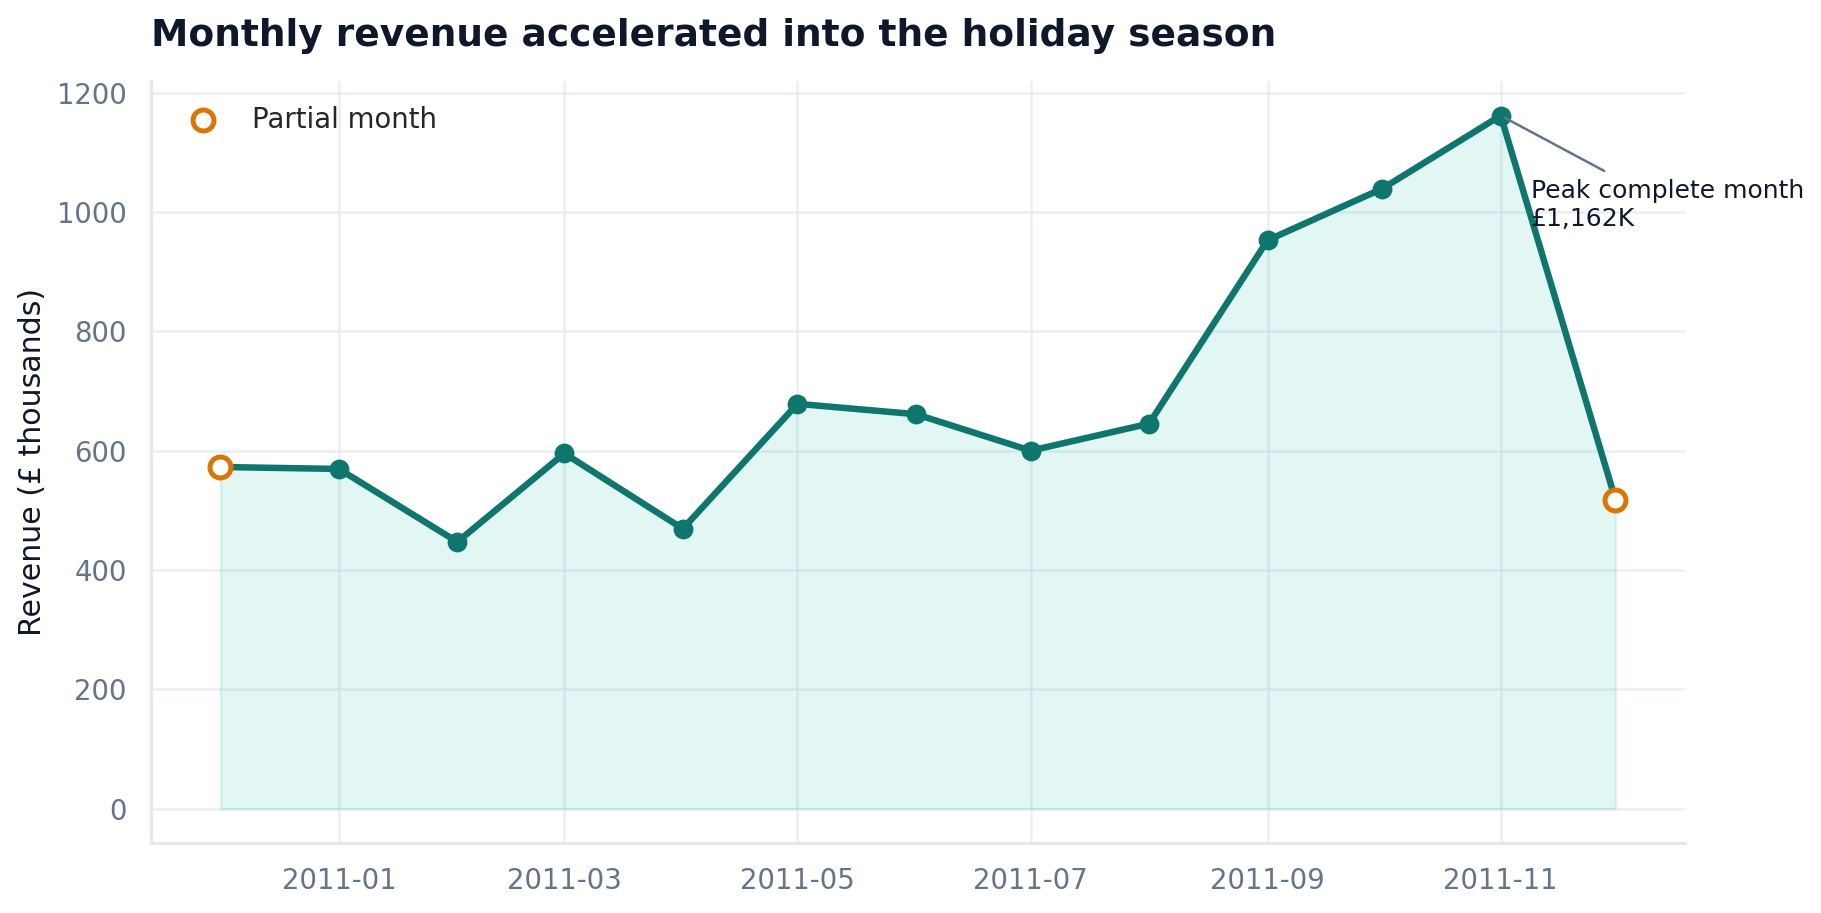
Use the September–November increase as an inventory and campaign planning signal, while validating the pattern with additional years before treating it as recurring seasonality.
Monitor concentration
Build a service strategy for high-value customers and track revenue concentration over time so the loss of a small number of customers does not create an outsized shock.
What this demonstrates
This project shows my ability to carry an analysis from raw transactional data through cleaning, relational modeling, SQL querying, exploratory analysis, segmentation, visualization, validation, and business communication.
I also documented reproducibility through scripts, a Makefile, validation checks, methodology notes, a data dictionary, and a structured repository rather than treating the notebook as the entire deliverable.
Limitations
The dataset covers one retailer and roughly one year, so it cannot establish stable seasonality or causal effects. Customer-linked analysis excludes transactions without customer IDs, and the data contains revenue rather than cost or profit. Marketing exposure, return reasons, channels, and customer demographics are also unavailable, so recommendations are framed as testable actions rather than causal conclusions.